»Volume 2014 Issue 01 (March)
Identification of Salmonella Enterica Serovar Enteritidis Vaccine Strains by Fourier Transform Infrared Spectroscopy
Norman Mauder, Jörg Rau
Chemisches und Veterinäruntersuchungsamt Stuttgart
Schaflandstraße 3/2
70736 Fellbach, Germany
Email: Joerg.Rau@cvuas.bwl.de
Keywords:
FT-IR, bacteriology, diagnostic investigation
Download as » PDF (607 KB)
Abstract
In cases of salmonellosis in humans, the most frequently isolated serovars of Salmonella enterica are Enteritidis (serogroup D1) and Typhimurium (serogroup B). In order to control the main sources of this zoonotic pathogen, poultry populations are treated with attenuated live vaccines. The distinction between vaccine strains and pathogenic wild type strains requires specific assays. For differentiation of two poultry vaccine serogroup D1 strains, TAD Salmonella vac® E and Salmovac SE, from other salmonellae of serogroup D1, a new method was developed by means of Fourier transform infrared (FT-IR) spectroscopy and artificial neural networks (ANN). To train the ANN, 548 spectra of 74 serogroup D1 isolates were used. Both vaccine strains could be differentiated from wild type strains of the same serogroup with an error rate of less than 1 % in replicate analyses. Moreover, this study revealed the potential of FT-IR spectroscopy for identifying salmonella strains to trace contamination routes.
Introduction
The Salmonella (S.) serovars Enteritidis and Typhimurium are the two most frequent serovars causing salmonellosis in humans in Germany. In this country a considerable source of these pathogens are poultry populations. 29 % of larger (1000+ animals) laying hen holdings were infected with Salmonella in the years 2004 to 2005 (EFSA, 2007). European efforts have striven to reduce the prevalence of these Salmonella types on affected farms as required by regulation, which recommends precautionary vaccination of the animals as a possible measure (regulation EG 2160/2003).
Immunization of poultry against S. Enteritidis infections is achieved by administering live vaccines, i.e. attenuated S. Enteritidis strains. These particular strains are not pathogenic to humans and, because of their auxotrophic metabolism, do not survive in the environment for long. After oral administration via drinking water, immunity develops within two weeks and persists for at least one year (Hahn, 1999). During the process of developing immunity, the animals excrete the vaccine strain at a declining rate (Hahn, 1999). In the case of positive findings of S. Enteritidis a clear distinction between the vaccine and potentially pathogenic wild type strains is crucial during subsequent examinations of this immunized livestock. The reason is that the finding of Salmonella can lead to considerable financial loss, if the eradication of the livestock and further disinfection should be necessary. Therefore, a rapid clarification of the result and a highly reliable and accurate analytical method are paramount.
For this purpose, there are special test kits available by vaccine manufacturers, such as AviPro® PLATE (Lohmann Animal Health GmbH & Co. KG, Cuxhaven) or the IDT Salmonella Diagnostikum (IDT Biologika GmbH, Dessau-Roßlau), which require an incubation of the sample strain in two media for 48 h. Differentiation by these kits is based on either the special nutrient requirements of the vaccine strains (IDT Salmonella Diagnostikum product documentation, version 01/2007) or on the sensibility to certain antibiotics (AviPro® PLATE product documentation version 7.0, 03/2012).
Since relying on only one physiological marker such as auxotrophy or an antibiotic resistance pattern alone may be risky in certain cases, it would be useful to have an additional method available that is based on a different principle of analysis. A genetic approach such as a specific PCR could be such an alternative; however, it doesn't seem to be economically feasible.
In the past, Fourier transform infrared (FT-IR) spectroscopy was successfully applied for differentiation of gram-positive and gram-negative bacteria below the species level (Wenning et al., 2013; Kuhm et al., 2009; Rebuffo-Scheer et al., 2007). In case of Salmonella this quick and economic method was used to investigate phenotypic changes due to stress response (Alvarez-Ordóñez et al., 2010), for phage type identification (Preisner et al., 2010), and for serovar differentiation (Baldauf et al., 2006; Preisner et al., 2011).
In this study, FT-IR spectroscopy was evaluated for a reliable discrimination of S. Enteritidis vaccine strains and other Salmonella of serogroup D1.
A method for differentiation of the most prevalent Salmonella serogroups had already been established at CVUA Stuttgart (Pantchev et al., 2008). Based on this method, two submodules for finding vaccine strains amongst S. enterica of serogroup D1 were developed. Application of these two modules allows for differentiation between both the accredited vaccine strains TAD Salmonella vac® E (AviPro®, Lohmann Animal Health GmbH & Co. KG, Cuxhaven) and Salmovac SE (IDT Biologika GmbH, Dessau-Roßlau), respectively.
Materials and Methods
Strains
For this study, 74 previously serotyped salmonella strains were analyzed, belonging to the serovars Enteritidis (68 strains), Eastbourne (2 strains), and Lome, Sendai, Typhi and Gallinarum (one strain each). The vaccine strains Salmovac SE and TAD Salmonella vac® E belong to serovar Enteritidis and were isolated directly from the matrix of the commercial vaccine product. Three additional Salmovac SE isolates were obtained from poultry farm floors that are routinely probed by official veterinarians. All strains were isolated at CVUA Stuttgart, either from food or veterinary diagnostic samples. According to the White-Kauffmann-Le Minor scheme, all of them were classified into serogroup D1 (i.e. O:9) (Grimont & Weill, 2007). Serotyping was performed by slide agglutination with polyspecific anti-salmonella sera (groups A-E) followed by serogroup-specific, O-specific and H-specific sera (Sifin, Berlin).
Standard test for vaccine strain
The identification of Salmovac SE strains was performed using the IDT Salmonella Diagnostikum according to the manufacturers’ instructions (IDT Biologika GmbH).
FT-IR spectroscopy
Strains were streaked out on sheep blood agar (Oxoid GmbH, Wesel) and incubated at 37 °C for 24 h (+/- 0,5 h). Cells were taken off the agar surface by means of a loop and suspended in 80 µl distilled water. 25 µl were transferred onto a zinc selenide (ZnSe) 96-well format optical plate (sample holder) and dried. For spectra recording, a FT-IR spectrometer TENSOR 27 combined with the HTS-XT Module used for microtiter plate scanning was employed. For data processing, the manufacturer's software OPUS 6.5 was used. Each isolate was analyzed in the course of at least six preparations; the five vaccine strain isolates a minimum of 24 times. Data preprocessing was performed using NeuroDeveloper software (Synthon GmbH, Heidelberg; Udelhoven et al., 2003). In case of Salmovac SE, the second derivative of the spectra within wave number range 550 cm-1 to 1200 cm-1 was calculated and subsequently vector-normalized. The resulting 674 data points were filtered by the NeuroDeveloper COVAR algorithm with respect to relevance of the target discrimination criteria. By help of a covariant matrix, this algorithm determines independent data points which give a highly significant difference between the two classes – in this case, vaccine strain vs. non-vaccine strain. These data points (n = 363) were used as input for the so-called input neurons for the artificial neural network (ANN).
To distinguish vac® E from its vicinity, in contrast to the above-mentioned procedures, a wave number range between 550 cm-1 and 1800 cm-1 was used, resulting in 1296 data points. Instead of using the COVAR algorithm, by means of a principle component analysis (PCA), 20 principle components were extracted and subsequently normalized via the autoscaling function.
Method development and cross validation
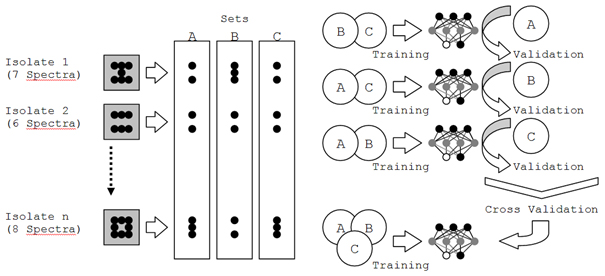
In order to assess the quality of differentiation, a cross validation was employed, by which all spectra were either used for the ANN training or for subsequent evaluation at different times.
Thus, spectra were first divided into three sets of 182, 183 and 183 spectra each. Division was carried out using stratified random sampling by strain. In each of the three training rounds, two sets served as a training basis for enabling the ANN to discriminate between the vaccine strains and field strains. Subsequently, the resulting net was validated using the remaining third set. The entirety of all three validations served to assess the quality of a net which was trained using spectra of all three sets simultaneously (Figure 1). In subsequent analyses, cross validation was automated using RapidMiner 5 software (Rapid-I GmbH, Dortmund); and data preprocessing (derivation, vector normalization) was performed using first OPUS and eventually RapidMiner 5 (wave number range restriction and principle component analysis). Three-dimensional data visualization was performed using POV-Ray 3.6 (Persistence of Vision Raytracer Pty. Ltd., Victoria, Australia).
Results
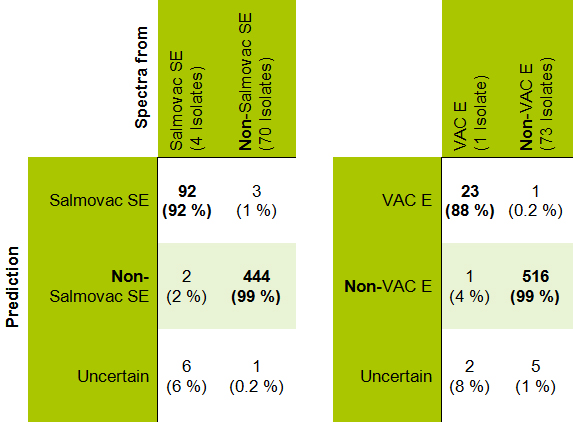
548 infrared spectra from 74 salmonella isolates were recorded. The capability of the vaccine strains Salmovac SE and TAD Salmonella vac® E to be differentiated from their vicinity was assessed by means of a cross validation. Results are shown in Table 1. 92 % of the Salmovac and 88 % of the VAC E spectra were correctly classified. Approximately 2 % of the Salmovac SE and 1 % of the vac® E spectra were incorrectly classified as non-vaccine strains. The ANN was not able to classify 6 % or 8 % of the spectra, respectively. No confusion between the two vaccine strains was noted. In contrast, spectra of non-vaccine strains were incorrectly classified as either vaccine strains or rendered doubtful in only less than 1 % of the cases.
As the next step, the data from the cross validation was used to calculate the probability of an isolate being classified as correct, doubtful or false, using a replicate analysis. This procedure corresponds to the routine examination and evaluation of sample-isolates. The average of these results was taken for all isolates; the vaccine strain Salmovac SE was classified correctly in 95.6 % of the cases, and falsely in 0.2 %. Similarly, TAD Salmonella vac® E was allocated correctly in 95.6 % of all cases and incorrectly for 0.2 %. The respective probabilities for non-vaccine strains are at least 98.7 % for a correct and a maximum of 0.1 % for a false classification.
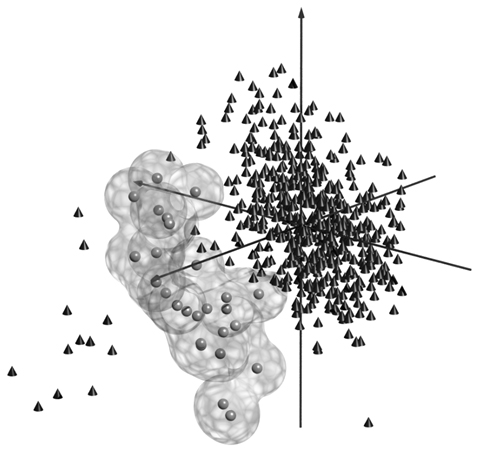
For visualization of the separability of an isolate from its vicinity, the spectral data points of TAD Salmonella vac® E with reference to all other data points are displayed in a three-dimensional model (Figure 2). For the three dimensions, three principle components were chosen which strongly discriminate VAC E values from the values of other isolates.
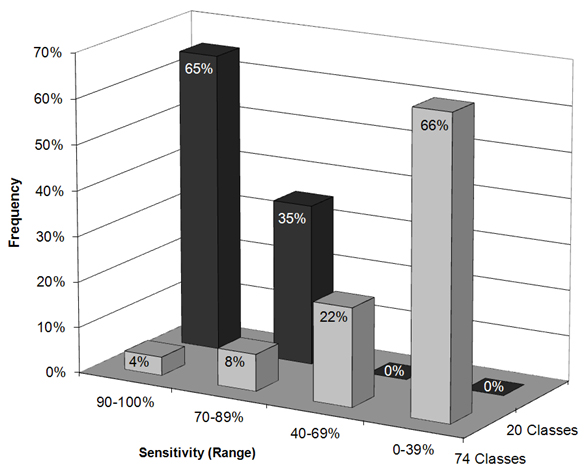
In order to investigate the separability of other isolates from their vicinity in a similar fashion, RapidMiner was used to train ANNs for the differentiation of all 74 isolates and subsequent cross validation. As a result, three isolates (one of which being vac® E) were correctly identified at a level of at least 90 % and a further six strains at a level of at least 70 %. In subsequent steps, isolates that were not separable were manually combined in joint classes. This procedure was repeated several times. Eventually, 20 well separable classes resulted in this way, none of which had a hit rate of less than 81 %. The mean hit rate was at a level of 93 % (Figure 3). As expected, the four Salmovac SE vaccine strain isolates clustered together as a class of their own. The TAD Salmonella vac® E vaccine strain formed its own class, which was also the case for a further seven isolates, these consisting of one of the two S. Eastbourne isolates, the serovar Lome and Typhi isolates and four of the Enteritidis serovars.
Discussion
Different research groups have demonstrated the capability of FT-IR spectroscopy to distinguish between salmonella at a sub-species level. Several serotypes from different serogroups (Kim et al., 2005; Baldauf et al., 2006; De Lamo-Castellví et al., 2010; Preisner et al., 2011) as well as S. Enteritidis phage types (Preisner et al., 2010) have been successfully differentiated.
At CVUA Stuttgart several hierarchically stacked classification modules are used for differentiation of bacterial isolates by FT-IR spectroscopy (Kuhm et al., 2009; Pantchev et al., 2008; Rau et al., 2009). They are based on artificial neural networks and manage to classify the obtained spectra into the respective family, genus, species etc. group levels. The modules presented here follow an existing method previously developed at CVUA Stuttgart. By using this method, salmonella are differentiated from a background of other gram-negative bacteria and identified at the serogroup level (Pantchev et al., 2008). In accordance with their prevalence in food and veterinary samples, serogroup D1 isolates were available in greater numbers. Because of that, identification of D1-Salmonella was possible using extensive infrared spectroscopy data. As expected, the vaccine strains Salmonella VAC E and Salmovac SE were classified as D1-serogroup Salmonella when using the above mentioned modules.
The modules described here, which follow the previous serogroup module (Pantchev et al., 2008), discriminate between the strains TAD Salmonella vac® E and Salmovac SE within the D1 serogroup, represented by 74 isolates. While probabilities of 91.9 % and 95.6 % were obtained for correct allocation (i.e. sensitivity), respectively, the probability for a false result was less than 1 %. This shows that the isolates’ infrared spectra carry significant information even for correct recognition of the attenuated vaccine strains.
An external validation with strains that were not included in this method setup would currently be possible only with Salmonella D1 field strains (non-vaccine strains). More specifically, further vaccine strain isolates from poultry farms which have been passaged within the animals are not available at this point in time. Investigating these would enable the assessment of a potential phenotypic drift of the vaccine strains over the course of the infection.
While three Salmovac SE strains have been included in the database, further strains would be useful for an external validation. For vac® E, isolates from treated animals were not available.
As demonstrated for the vaccine strains, a differentiation of individual salmonella strains (the vaccine strains, in this case) is possible. Thus, the question arose as to whether FT-IR spectroscopy would also be capable of a direct comparison in an epidemiological context, e.g. between a human pathogenic isolate and an isolate from the food consumed. Therefore, the existing data set was analyzed in order to group the 74 Salmonella D1 isolates into classes.
As expected, it was not possible to assign each isolate to an individual class of its own. However, by successive combination of similar isolates, 20 classes, so called “spectrovars” were able to be defined within the present data set. These might enable contamination route trace analyses, similar to fine-typing using molecular biological methods. In reference laboratories, fine-typing is frequently done by pulsed-field electrophoresis (PFGE) or, specifically in the case of Salmonella, by MLVA (Multiple-locus variable-number tandem-repeat analysis) as multiplex-PCR (Cho et al., 2007). The latter displays a similar or even higher discrimination potential than PFGE (Lindstedt et al., 2003). This potential will, in all likelihood, not be reached with FT-IR spectroscopy. However, the spectroscopical method is impressive, both in terms of its speed and simplicity in handling as well as its flexibility in reacting to individual issues that may arise. In addition, FT-IR spectroscopy’s potential for fine-typing of strains has not been fully exhausted here, as sample preparation was intended to be as simple as that of performing species identification. In order to spectroscopically emulate classical phage typing methods used for Salmonella fine-typing, greater preparatory efforts must be undertaken. Other research groups have demonstrated phage type analysis to be possible by means of FT-IR spectroscopy, if outer membrane protein extracts are analyzed instead of whole bacterial cells (Preisner et al., 2010). An increase in differentiation capability between serotypes can be obtained by suspending bacterial cells in 50 % acetonitrile in the course of sample preparation (Baldauf et al., 2007).
Acknowledgement
We thank Barbara Depner and Mandy Hailer for organizing and performing the extensive tasks in the lab. The English translation was kindly done by Helene Oberreuter.
References
Alvarez-Ordóñez A., J. Halisch, M. Prieto (2010): Changes in Fourier transform infrared spectra of Salmonella enterica serovars Typhimurium and Enteritidis after adaptation to stressful growth conditions. Int. J. Food. Microbiol. 142(1–2), 97 105. Epub 2010 Jun 17.
Baldauf N.A., L.A. Rodriguez-Romo, A.E. Yousef, L.E. Rodriguez-Saona (2006): Differentiation of selected Salmonella enterica serovars by Fourier transform mid-infrared spectroscopy. Appl. Spectrosc. 60(6), 592 8.
Baldauf N.A., L.A. Rodriguez-Romo, A. Männig, A.E. Yousef, L.E. Rodriguez-Saona (2007): Effect of selective growth media on the differentiation of Salmonella enterica serovars by Fourier-Transform Mid-Infrared Spectroscopy. J. Microbiol. Methods 68(1), 106–14. Epub 2006 Aug 14.
Cho S., D.J. Boxrud, J.M. Bartkus, T.S. Whittam, M. Saeed (2007): Multiple-locus variable-number tandem repeat analysis of Salmonella Enteritidis isolates from human and non-human sources using a single multiplex PCR. FEMS Microbiol Lett. 275(1): 16–23. Epub 2007 Aug 10.
De Lamo-Castellví S., A. Männig, L.E. Rodríguez-Saona (2010): Fourier-transform infrared spectroscopy combined with immunomagnetic separation as a tool to discriminate Salmonella serovars. Analyst 135(11), 2987 92. Epub 2010 Sep 28.
EFSA (2007): Report of the Task Force on Zoonoses Data Collection on the Analysis of the baseline study on the prevalence of Salmonella in holdings of laing hen flocks of Gallus gallus, The EFSA Journal (2007) 97, doi:10.2903/j.efsa.2007.97r.
The European Parliament and the Council of the European Union (2003): Regulation (EC) No 2160/2003 of the European Parliament and of the Council of 17 November 2003 on the control of salmonella and other specified food-borne zoonotic agents. ABl. L 325 of 12.12.2003, p. 1–15.
Grimont, P.A.D., F.-X. Weill (2007): Antigenic Formulae of the Salmonella Serovars, 9th edition. WHO Collaborating Centre for Reference and Research on Salmonella.
Hahn, I. (1999): Ein Beitrag für den Verbraucherschutz: TAD Salmonella vac® E – ein neuer Lebendimpfstoff für Hühner gegen Salmonella Enteritidis. Lohmann Information 3/1999, 17–20 (German).
Kim, S., B.L. Reuhs, L.J. Mauer (2005): Use of Fourier transform infrared spectra of crude bacterial lipopolysaccharides and chemometrics for differentiation of Salmonella enterica serotypes. J. Appl. Microbiol. 99, 411–417
Kuhm A., D. Suter, R. Felleisen, J. Rau (2009): Identification of Yersinia enterocolitica at the Species and Subspecies Levels by Fourier Transform Infrared Spectroscopy. Appl. Environ. Microb., 75(18), 5809–5813
Lindstedt B.A., E. Heir, E. Gjernes, G. Kapperud (2003): DNA fingerprinting of Salmonella enterica subsp. enterica serovar Typhimurium with emphasis on phage type DT104 based on variable number of tandem repeat loci. J. Clin. Microbiol. 41(4), 1469–1479.
Pantchev A., S. Horlacher, J. Rau (2008): Differenzierung von Salmonellen mittels FT-IR. In: Deutsche Veterinärmedizinische Gesellschaft: Programm- und Abstract-Band / DVG. - Lampertheim: Alpha-Informations-Ges. Teil 49, (German).
Preisner O., R. Guiomar, J. Machado, J.C. Menezes, J.A. Lopes (2010): Application of Fourier transform infrared spectroscopy and chemometrics for differentiation of Salmonella enterica serovar Enteritidis phage types. Appl. Environ. Microbiol. 76(11), 3538 44. Epub 2010 Apr 2.
Preisner O., J.C. Menezes, R. Guiomar, J. Machado, J.A. Lopes (2012): Discrimination of Salmonella enterica serotypes by Fourier transform infrared spectroscopy. Food Res. Int. 45(2), 1058–1064.
Rau J., Perz R., Klittich G. and Contzen M. (2009): Cereulide forming presumptive Bacillus cereus strains from food – differentiating analyses using cultural methods, LC-MS/MS, PCR, and infrared spectroscopy in consideration of thermotolerant isolates, Berl. Munch. Tierarztl. Wochenschr. 122, 25–36, (German).
Rebuffo-Scheer C.A., J. Schmitt, S. Scherer (2007): Differentiation of Listeria monocytogenes Serovars by Using Artificial Neural Network Analysis of Fourier-Transformed Infrared Spectra. Appl. Environ. Microbiol. 73(3), 1036–1040.
Udelhoven T., M. Novozhilov, J. Schmitt (2003): The NeuroDeveloper: a tool for modular neural classification of spectroscopic data. Chemometr. Intell. Lab. Syst. 66, 219–226.
Wenning M, Scherer S (2013): Identification of microorganisms by FTIR spectroscopy: perspectives and limitations of the method. Appl. Microbiol. Biotechnol. 97, 7111–7120
End of Article.
Share it: ![]()
![]()
![]()
![]()
